The fundamental properties of materials and their applications are of paramount importance to engineers for development of devices and components with intended functional requirements. In the modern world materials for fabrication are selected based on desired properties and characteristics for the intended functions of specific parts keeping in view their manufacturing cost. In this chapter a general introduction to materials specifically metals and their properties are given.
1. To understand the use of material properties for selection of appropriate materials for engineering applications.
2. To understand the qualitative and quantitative description of mechanical properties of materials.
Varieties of materials are available for manufacturing products, each having its own characteristics, applications, advantages and limitations. There are four major classes of materials used in engineering as shown below.
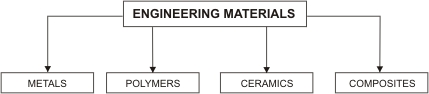
Classification of Engineering Materials
Metals are materials in which the bonding electrons are not confined to one location in the material, but are free to move large distances. This type of bonding confers several useful properties common to metals, such as high electrical and thermal conductivity, the ability to be deformed or cut into new shapes without breaking, good fracture toughness, and high mechanical strength. Metals are a group of elements that reflect all or most of the following features:
(i) Atoms are arranged in a regular repeating structure
(ii) Relatively strong
(iii) Dense
(iv) Malleable or ductile: high plasticity
(v) Resistant to fracture: tough
(vi) Excellent conductors of electricity and heat
(vii) Opaque to visible light
(viii) Shiny in appearance
3.3.1 Applications
Metals can be available in many forms such as castings, plates, sheet, foil, bar, tube, wire, extrusions, rolling, forgings, stampings and powder. Some common products made from metals are:
(i) Electrical wiring
(ii) Structures: buildings, bridges, etc.
(iii) Automobiles: body, chassis, springs, engine block, etc.
(iv) Airplanes: engine components, fuselage, landing gear assembly, etc.
(v) Trains: rails, engine components, body, wheels
(vi) Machine tools: drill bits, hammers, screwdrivers, saw blades, etc.
(vii) Shape memory materials
(viii) Magnets
(ix) Catalysts
3.3.2 Type of Metals
The natural sources of metals are distributed throughout the world, and may be mined from earth or on its surface, or even dredged from under water. (Copper, Iron, Zinc, Silver etc.)
All metals are divided into one of the two groups: i.e. Ferrous metals and non-ferrous metals.
Ferrous metals
Metals, which contain iron, are called ferrous metals. Ferrous metals appear in the form of cast iron, carbon steel, and alloy steels. The various alloys of iron, after undergoing certain processes, are pig iron, gray cast iron, white iron, white cast iron, malleable cast iron, wrought iron, alloy steel, and carbon steel. All ferrous metals are magnetic and have little resistance to corrosion.
Non-Ferrous Metals
Metals that do not contain iron are called non-ferrous metals. Aluminum, copper, magnesium, titanium and thin alloys are among those metals that belong to Non-Ferrous metals group. They are not magnetic and are usually more resistant to corrosion than ferrous metals.
3.3.3 Some Facts about Metals
(i) The melting points of metals range from about -39oC for mercury to 3410oC for tungsten. The resistance of a tungsten filament bulb increases ten times between room temperature and its operating temperature.
(ii) Iridium with specific gravity 22.6, is the densest metal, and lithium with specific gravity 0.53, is the least dense.
(iii) The high thermal conductivity makes metals cold to touch as they conduct the heat away from the fingers or hand.
(iv) Metals warm up and cool down rapidly. The metal surfaces gain/lose heat from/to their surroundings.
(v) Passing a current through a metal causes it to heat up as electrons are constantly and randomly colliding with metal cations causing vibration.
(vi) Bismuth has the lowest electrical conductivity of the metallic elements, and silver the highest at ordinary temperatures.
(vii) All metals expand when heated and contract when cooled, but certain alloys, such as platinum and iridium alloys, have extremely low coefficients of thermal expansion.
(viii) Physically, metals are strong and can overcome different types of stresses.
The properties of metals are classified into four categories as shown in the table below:

Classification of properties of metals
Chemical properties are material characteristics that relate to the structure of a material and its formation from chemical elements. These properties are usually measured in chemical laboratories, and they cannot be determined by visual inspection.
(i) Composition relates to the elemental or chemical components that make up a material, and the relative proportions of these components.
(ii) Microstructure is the structure of polished and etched materials as revealed by microscopes having magnifications greater than ten diameters. The microstructure includes the phases present, the morphology of the phases and their fraction present.
(iii) Crystal structure is the ordered, repeating arrangement of atoms or molecules in a material. Examples of crystal structures are Face Centered Cufic (FCC), Body centred Cufic (BCC), Hexagonal Close Packed (HCP) structures.
(iv) Corrosion resistance is the ability of a material to resist deterioration by chemical or electrochemical reaction with its environment.
Dimensional properties relate to available size, shape, finish and tolerances on materials. These properties are used during the selection of material for a particular engineering application.
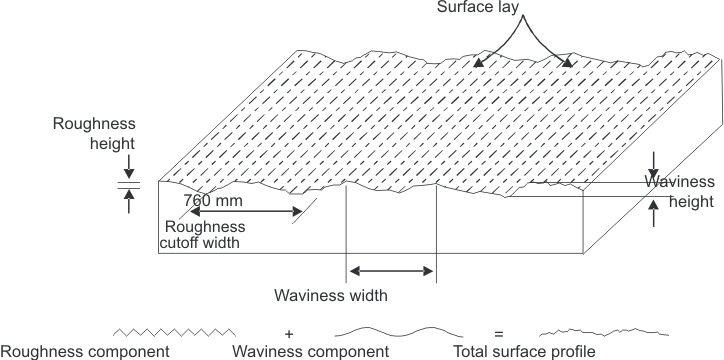
Fig. 1.1: Dimensional properties of material
(i) Roughness relates to finely spaced surface irregularities, such as height, width, and direction, which establish a definite surface pattern.
(ii) Waviness is a wave like variation from a perfect surface, generally much wider in spacing and higher in amplitude than surface roughness.
(iii) Lay is the direction of predominating surface pattern, usually after machining.
(iv) Camber is deviation from edge straightness, usually the maximum deviation of an edge from a straight line of given length.
(v) Out of flat is the deviation of a surface from a flat plane usually over a microscopic area.
(vi) Surface finish is the microscopic and macroscopic characteristic that describes a surface.
Physical Properties are characteristics of materials that pertain to the interaction of these materials with various forms of energy and with other forms of matter. The material does not have to be destroyed or changed to measure physical properties.
(i) Color relates to the quality of light reflected from the metal.
(ii) Density is the weight of a unit volume of a material. Density is an important consideration when choosing a material to be used in the design of a part in order to maintain the proper weight and balance of the part. Most metals have relatively high densities, mainly compared to polymers.
(iii) Specific gravity is the ratio of the mass of a given volume of the metal to the mass of the same volume of water at a specified temperature, usually 4oC.
(iv) Melting point is the temperature at which the metal changes from a solid to a molten state. A metal's fusibility is related to its melting point.
(v) Conductivity: Thermal and Electrical conductivity relate to the metal's ability to conduct or transfer heat and electricity. Conductivity is the property that enables a metal to carry heat or electricity.
(vi) Thermal conductivity is a measure of the rate of flow of heat per unit area and per unit temperature gradient i.e. the ability of a metal to transmit heat throughout its mass. The heat conductivity of a metal is important in welding as it governs the amount of heat that will be required for proper fusion. Conductivity of the metal also determines the type of jig to be used to control expansion and contraction.
Copper has the highest thermal conductivity among common metals, exceeded only by silver. Aluminum has approximately half the thermal conductivity of copper, and steels have about one-tenth the thermal conductivity of copper.
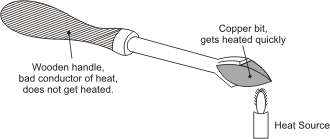
Fig. 1.2 Thermal Conductivity: Soldering iron rod having copper bit at the tip
Consider a soldering iron rod shown in figure 1.2, the 'bit' is of copper because it is one of the best conductors of heat, thus it will heat up the joint quickly. On the other hand, handle is made of wood is non-metals are bad conductor of heat, thus wooden handle will protect the operator of the soldering iron from being burnt.
(vii) Electrical conductivity is the capacity of metal to conduct an electric current. A measure of electrical conductivity is provided by the ability of a metal to conduct the passage of electrical current. Consider the case of electric cable shown in figure 1.3, where insulation of cable is done with plastic, as it is poor conductor of electricity and the copper wire is used for conducting the electric current. The units of electrical conductivity are mho/m where mho is the reverse of ohm, the unit for electrical resistance.
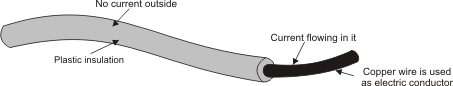
Fig. 1.3 Electrical Conductivity Copper wire is used as electric conductor
(viii) Fusibility is the ability of a metal to become liquid by the application of heat. Metals are fused in welding. Solder melts at a low temperature. Therefore, it has a high fusibility. On the other hand fire-brick only melts at very high temperatures. Therefore it has a low fusibility. Steels fuse around 1400oC and aluminum alloys at approximately 760oC.
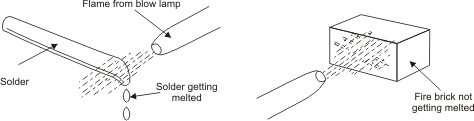
Fig. 1.4 High flame
(ix) Coefficient of linear thermal expansion. Most of the solids expand when they are heated and contract when they are cooled. The coefficient of linear thermal expansion is a measure of the linear increase per unit length based on the change in temperature of the metal. The expansion of a metal in a longitudinal direction is known as the linear expansion. When metals increase in size, they increase not only in length but also in breadth and thickness. This is called volumetric expansion. Aluminum has the greatest coefficient of expansion, expanding almost twice as much as steel for the same temperature change.
(x) Curie point is the temperature at which ferromagnetic materials can no longer be magnetized by outside forces. Generally it is defined as the temperature at which certain magnetic materials undergo a sharp change in their magnetic properties.
(xi) Refractive index is defined as a measure of the bending of ray of light when passing from one medium into another. It is expressed as ratio of speed of light in vacuum to that in the considered medium.
Material responses can be described quantitatively in terms of mechanical properties. Therefore, engineers must know how metals internally (micro structure) react to external forces (tension, compression, torsion, bending, and shear). These internal reactions of a metal, to external forces are known as mechanical properties. Metals respond to these forces by elastic deformation, permanent deformation, or fracture and time-dependent effects of external forces such as creep and fatigue. Mechanical properties often are the most important because virtually all fabrication processes and most service conditions involve some kind of mechanical loading.
Constructional materials are required to withstand the action of considerable forces without undergoing considerable amounts of distortion. In manufacturing engineering, however, a material must be capable of permanent deformation at the expense of as little energy as possible. That is, it must be malleable and ductile. In a forming process metal loses, its softness and becomes harder and stronger, it work hardens. Thus the production engineer designs forming process to utilise the malleability or ductility of the material and at the same time generates in it sufficient strength for subsequent service.
Thus, in selecting materials one must know the mechanical properties of a material and what they stand for. Generally, all mechanical properties are directly related to each other. A change in one property usually causes a change in one or more additional properties. For example, if the hardness of a metal is increased, the brittleness usually increases and the toughness usually decreases. The atomic bonding of metals also effects their properties. These properties of metals determine the range of usefulness of the metal and establish the service that can be expected. These properties also help to specify and identify the metals.
The most common mechanical properties are discussed below. Different types of external loads are shown in figure 1.5.
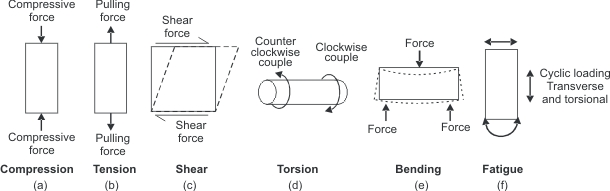
Fig. 1.5 Types of loading
Compression, If the forces applied are directly towards the body or on the body, i.e., applied force tend to press the body, crush the body is said to been in compression, as shown in figure 1.5(a). A column that supports an overhead beam is in compression, and the internal stresses that develop within the column are compressive in nature.
Tension, If the forces applied are directed away from the body, i.e., applied force tend to pull a shown in figure 1.5(b), apart or stretch the body, the body is said to be in tension. Tension is a set of equal and opposite pulling forces that act along a specified direction; an example is the force in a cable holding a weight, or when using a wire rope to lift a load.
Shear force, A force acting parallel or tangential to a section taken through a material (i.e. in the plane of the material) is called a shear force, as shown in figure 1.5(c). The effect of shear stress is to distort the shape of a body by inducing shear strains. An element subjected to shear stresses only is said to be in pure shear. During shear strain the dimensions/volume of an element will not change in the x, y and z directions. Instead the shape of the element will change.
Torsion, refers to the twisting of a straight bar type workpiece when it is loaded by a torques that tend to produce rotation about the longitudinal axis of the bar, as shown in figure 1.5(d). Example : when screwdriver is turned by hands, hand applies a torque to the handle and twists the shank of the screwdriver. Other examples of bars in torsion are drive shafts, axles, propeller shafts, steering rods, and drill bits.
Bending, the system of forces that causes the formation of a curve in a beam is known as bending, as shown in figure 1.5(e). In engineering mechanics, bending also known as flexure, describes the behavior of a slender structural element subjected to an external load applied perpendicular to a longitudinal axis of the element / beam.
Impact, this is the sudden application of force on a structure or component. Figure 1.6 shows the impact caused by hammer on a workpiece. Generally impact is defined as application of a large amount of force for a short duration of time.
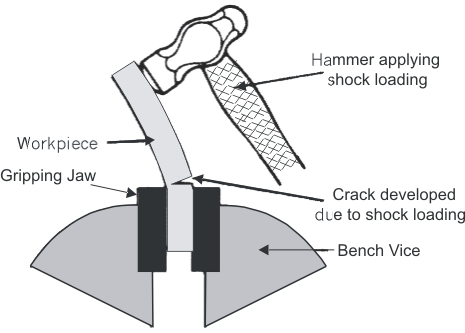
Fig. 1.6 Impact Strength: Component under shock load
Fatigue, In fatigue, load first acts in one direction, decreases to zero, and then rises to a maximum in the opposite direction, this cycle of reversals being repeated a number of times, as shown in figure 1.5(f). Fatigue occurs in materials, which are exposed, to frequent reversals of loading or repeatedly applied loads, repeated vibration or bending. Example, a thin steel rod can be broken by hand by bending it back and forth several times in the same place; however, if the same force is applied in a steady motion (not bent back and forth), the rod cannot be broken. No deformation is apparent during fatigue.
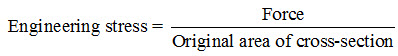
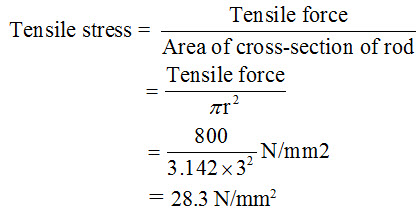
Stress is defined as force per unit area. It is expressed in Newtons per square metre (N/m2), though it is more conveniently measured in terms of Newtons per square millimetre (N/mm2).
Stress is calculated on the basis of the original area of crosssection.
Example: A steel rod 6 mm in diameter is under the action of a tensile force of 800 Newtons. Calculate the tensile stress in the bar.
Strain refers to the proportional deformation produced in a material under the influence of stress.
Example: A 30-mm gauge length is marked on an aluminium test piece. The test piece is strained in tension so that the guage length becomes 32.3 mm. Calculate the strain.
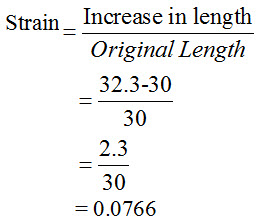
Strain is commonly quoted as a percentage. In this case:
= 7.66%
Strain may be either elastic or plastic. Elastic strain is reversible and disappears when the stress is removed. Strain is roughly proportional to the applied stress when the material obeys Hooke's Law. Hooke's Law states that, for an elastic body, strain produced is directly proportional to stress applied.
Young's Modulus of Elasticity (E) is the ratio between the stress applied and the elastic strain it produces. It is related to the rigidity of the material and is a value of supreme importance to the constructional engineer. The modulus of elasticity is expressed in terms of either tensile or compressive stresses and its units are the same as those for stress, since:
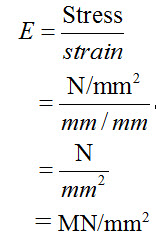
E is commonly expressed as GN/m2 or MN/mm2.
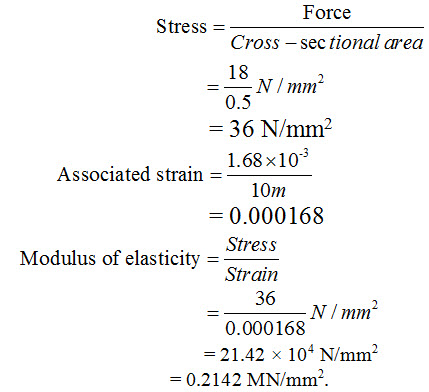
Example: A steel wire, 0.5 mm2 in cross-sectional area, and 10m long is extended elastically 1.68 mm by a force of 18 N. Calculate the modulus of elasticity for the steel.
Strength is the property that enables a metal to resist rupture under load. It is the ability of the material to withstand the stress causing a particular deformation condition.
The minimum stress needed to cause predetermined permanent deformation is called yield strength.
The ultimate strength of a material is the maximum stress that the material can withstand without failure.
Fracture strength is defined as the stress at fracture.
(i) Tensile strength
Tensile strength is defined as the maximum load in tension a material will withstand before fracturing, or the ability of a material to resist being pulled apart by opposing forces. Consider a rod attached to a fixed beam holding a weight, the load is stretching the rod. Refer figure 2.7, the force acting on the rod is tensile force and the rod is said to be in tension, The material from which the rod is made should have tensile strength to resist the tensile load to be applied on rod during service conditions.
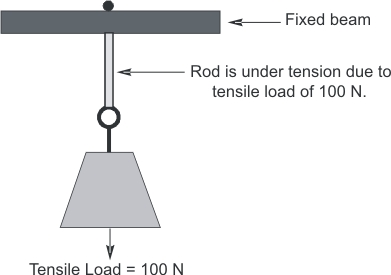
Fig. 1.7 Tensile Strength
(ii) Compressive Strength
Compressive strength is the maximum load in compression a material can sustain before crushing or a predetermined amount of deformation. The compressive strength of cast iron is greater than its tensile strength. Compressive strength is calculated by dividing the maximum load with the original cross section area of a specimen in a compression test. In figure 2.8, the load is compressing the component. The material from which the component is made needs to have compressive strength to withstand the load.
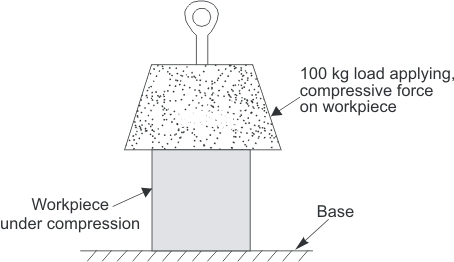
Fig. 1.8 Compressive Strength
(iii) Shear strength
Shear strength is the ability of a material to resist being fractured by opposing parallel forces acting on a straight line but not in the same plane, Depending on the type of connection, a connecting element (bolt, rivet, pin) may be subjected to single shear or double shear as shown in figure 1.9.
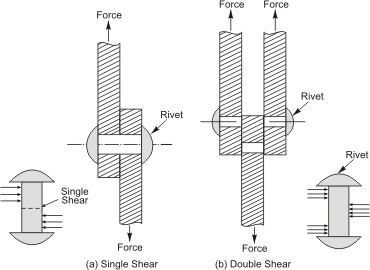
Fig. 1.9 Shear Strength: Rivet supporting a shearing load
(iv) Impact strength
Impact strength, is an indication of the toughness of a material. It is energy required to fracture a specimen subjected to impact. Highly brittle materials have low impact strength.
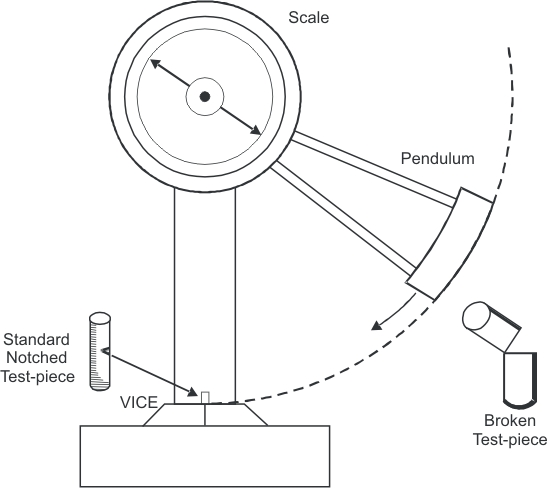
Fig. 1.10 The energy required to fracture the specimen is measured on the scale in joules
The test shown in figure 1.10 is practical indication of how a material will react to conditions of shock loading, and in many circumstances toughness will be more important than tensile strength as a criterion of suitability of a material. Example: shock absorbers used in automobiles and trains are designed to have impact strength.
(v) Fatigue strength
Fatigue strength is the ability of material to resist various kinds of rapidly changing stresses and is expressed by the magnitude of alternating stress for a specified number of cycles. Fatigue strength values are used in the design of machine components like motor shafts, gear teeth, turbine blades, airplane structure, aircraft wings, camshafts, connecting rod and other structures subject to rapidly fluctuating cyclic loads. It is determined directly from the S-N diagram.
Fatigue life is number of cycles of fluctuating stress and strain of a specified nature that a material will sustain before failure occurs. Fatigue life is a function of: (i) the magnitude of the fluctuating stress, (ii) geometry of the specimen and (iii) test conditions.
Fatigue Limit (endurance limit) is maximum fluctuating stress a material can endure for a very large number of cycles.
S-N Curve
If the stress(S) is plotted against the number of stress reversals(N), the curve first falls steadily and then almost runs parallel to the stress reversal axis. The stress at which the curve becomes horizontal is the fatigue limit. Example of this type of curve is shown in figure 1.11 for Steel and Aluminum.
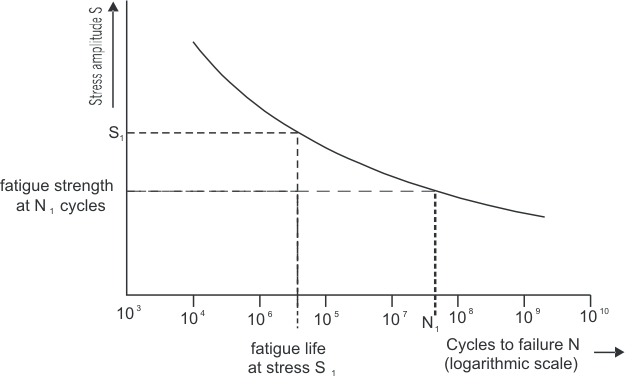
Fig. 1.11 General S-N curve for fatigue failure
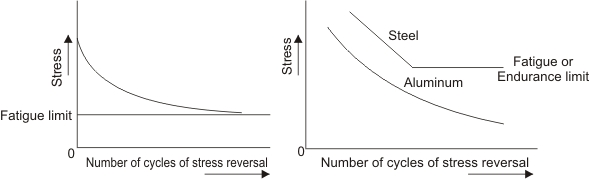
Fig. 1.12 S-N curves for fatigue failure for aluminium and steel
(vi) Creep
Creep is a slowly progressing, permanent deformation that occurs over a period of time due to a steady force acting on the material. Materials subjected to high temperatures are especially susceptible to this deformation. Creep extended over a long time, eventually leads to the rupture of the material. For example, the gradual loosening of bolts, the sagging of long-span electric cables, and the deformation of components of machines and engines.
Creep strength (creep limit) is maximum stress required to cause a specified amount of creep in a specified time. Creep rupture strength is stress required to cause fracture in a creep test within a specified time.
Slope of curve is creep rate and end point of curve is time for rupture. As indicated in plot of creep vs time with stress and temperature constant shown in figure 1.13, creep of a material can be divided into three stages. First stage or primary creep starts at rapid rate and slows with time. Second stage (secondary) creep has a relatively uniform rate. Third stage (tertiary) creep has an accelerating creep rate and terminates by failure of material at time for rupture.
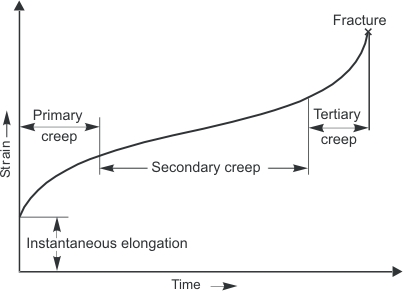
Fig. 1.13 Typical creep curve showing the three stages of creep with respect to time, during creep test
Creep recovery is rate of decrease in deformation that occurs when load is removed after prolonged application.
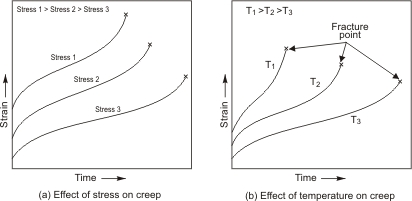
Fig. 1.14 Creep Curves
(vii) Elasticity and Elastic Deformation
External forces applied to a solid object may compress, stretch, twist, or bend it out of shape. The ability of an object to return to its original form when the external forces are removed is called the elasticity of the solid. Each metal has a point known as the elastic limit beyond which it cannot be loaded without causing permanent distortion. Springs are made from elastic material. If too much deformation occurs, the object will not return to its original shape - its elastic limit has been exceeded. The elastic limit is the point at which permanent damage starts. This property is extremely valuable because it would be highly undesirable to have a part permanently distorted after an applied load was removed. This desirable property is present in spring steel as shown in figure 2.15.

Fig. 1.15 Spring has elasticity property
(viii) Plasticity and Plastic Deformation
Plasticity is the ability of a material to undergo permanent deformation without rupture. If the stress is proportional to the strain, the material is said to be linear elastic, otherwise it is non-linear elastic. Beyond the elastic limit, some residual strain or permanent strain will remain in the material upon unloading. The amount of strain which is recovered upon unloading is called the elastic recovery. The characteristic of a material by which it undergoes permanent deformation is known as plasticity.
Plastic deformation is the ability of a material to undergo permanent deformation under the application of Load. At stresses exceeding elastic limit plastic deformation is observed.
For example currency coin as shown in figure 1.16 is made from a metal which has high plasticity so that it will retain the impression of the embossing tools.

Fig. 1.16 Currency coin as an example of plasticity
A material which is loaded into the plastic region will have a total strain which is the sum of the elastic strain (recoverable portion of the total strain) and the residual strain (permanent portion of the total strain). This behavior is shown in figure 1.17.
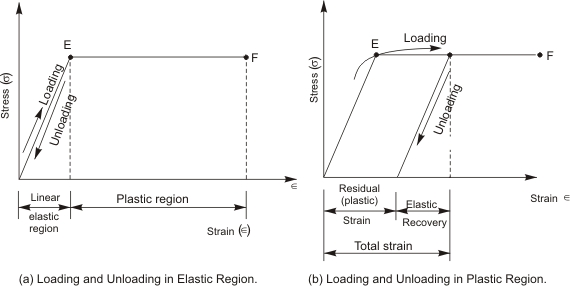
Fig. 1.17 Stress Strain Diagrams of Elastic, Perfectly Plastic Material
(ix) Resilience The resilience of a material is the amount of energy absorbed in the elastic range of deformation and is recovered on unloading. A material with greater resilience is capable of absorbing greater impact energy without any plastic deformation. Resilience should be considered when material is subjected to shock or impact loading. This property of material is important in the manufacture of shock absorbers, springs etc. Resilience is measured by the triangular area under the elastic portion of the stress-strain curve as shown in figure 1.18.
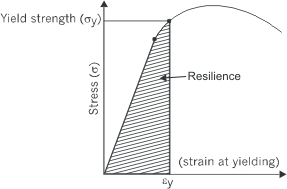
Fig. 1.18 Resilience (shaded portion) depicted on a stress Vs strain curve
(x) Ductility Ductility of a material enables it to be drawn out into thin wire. The two indicators of ductility are percentage elongation and reduction in area under tension. For example mild steel is a ductile material.
Ductility of a metal is a measure of the ability of a metal to withstand plastic deformation without fracturing. Ductility is the property of a metal that permits it to be permanently drawn into wire/tube, bent, or twisted into various shapes without breaking. For example, automobile body, cartridge case etc. Ductility is similar to malleability. The lack of ductility is brittleness (such as in cast iron). In the figure shown in 1.19, the rod which is being drawn through a die to reduce its diameter should have the property of ductility. The stress strain diagram for ductile material is shown in fig. 1.20.
Ductility is commonly expressed in practical terms as the percentage elongation in gauge length; a standard test piece suffers during a tensile test to failure.
Also related to ductility is reduction in cross-sectional area measured at the point of fracture.

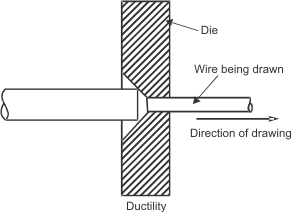
Fig. 1.19 Example of ductility, wire drawing
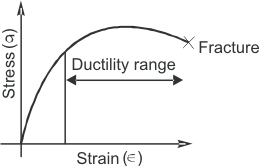
Fig. 1.20 Stress-Strain diagram for a ductile material
(xi) Malleability
Malleability is another measure of plasticity, it is the ability of a material to be flattened, under compression without rupture into sheets. Due to this property metal can be hammered, rolled, or pressed into various shapes without cracking or breaking and is said to be malleable. This property is necessary in sheet metal that is worked into curved shapes. Copper, Gold, Silver, Tin, and Lead are examples of metals exhibiting high malleability.
Example of malleability is forming the head of the rivet by hammering, as shown on figure 1.21(a). The rivet needs to be made from malleable material to withstand this treatment. Some materials may be malleable but they are not ductile. For example, lead can be easily hammered into thin sheets but cannot be drawn into wires, that is, lead is malleable but not ductile but silver is both malleable and ductile.
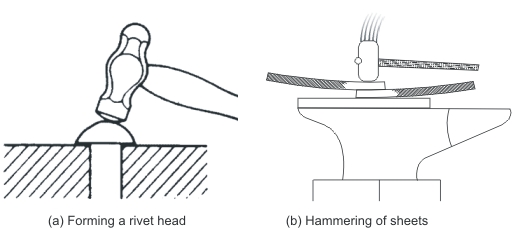
Fig. 1.21 Examples of malleability
(xii) Brittleness
If fracture occurs soon after the elastic limit is passed (fig. 1.22) the metal is said to be brittle. Brittleness is the property opposite to plasticity or ductility. Brittleness is the property of a metal because of which it breaks or shatters without much permanent deformation. Breaking of a chalk illustrates a brittle behavior. Cast iron, cast aluminum, and very hard steel are examples of brittle metals.
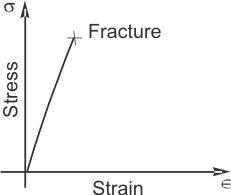
Fig. 1.22 Stress-strain diagram for a brittle material
(xiii) Toughness
Toughness is the ability of a material to absorb energy before rupture or fracture. A material that possesses toughness will withstand tearing or shearing and may be stretched or otherwise deformed without breaking. A tough metal, such as cold chisel, is one that can withstand considerable stress. Toughness is measured by impact test, high impact values indicating high toughness and is usually expressed as energy absorbed in an impact test.
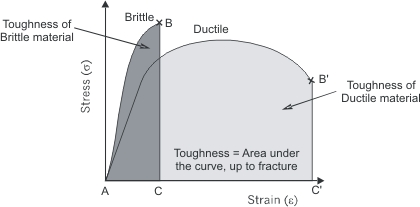
Fig. 1.23 Comparison of toughness of brittle and ductile materials
The area under the stress strain curve up to the point of fracture indicates toughness. A larger area under a stress strain curve will make a material more tougher that must be extensively deformed before it will fail. Alloy steels having good toughness are used in the manufacture of milling cutters, gears etc. Area ABC in the figure 1.23 indicates toughness of a brittle materials while AB'C' expresses that of a ductile material.
(xiv) Hardness
Hardness is the ability of a metal to resist localized plastic deformation. Hardness allows the material to withstand scratching, abrasion, penetration and wear by another material. The hardness of a metal has a definite relationship to the ability of the metal to be plastically deformed, and to the amount of instantaneous load required for deformation to take place. A soft surface is scratched more easily than a hard surface; thus a hard mineral, such as diamond, will scratch a soft mineral, such as graphite, and the hard mineral will not be scratched by the soft. Consider two plates of different materials i.e. one soft and the other hard. When these two plates are pressed by constant load with hard steel balls, it is observed that when the ball is pressed in to a hard material the ball only makes a shallow indentation, on the other hand, when pressed in to a soft material the ball makes a deeper penetration as shown in figure 1.24.
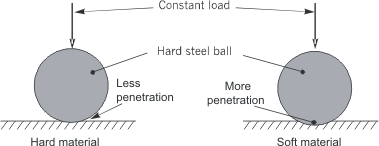
Fig. 1.24 Hardness as resistance to indentation
| Mineral | Hardness index |
|---|---|
| Diamond | 10 |
| Corundum | 9 |
| Topaz | 8 |
| Quartz | 7 |
| Orthoclase Feldspar | 6 |
| Apatite | 5 |
| Fluorite | 4 |
| Calcite | 3 |
| Gypsum | 2 |
| Talc | 1 |
In general terms hardness is defined as the ability of a material to resist surface abrasion. The relative hardnesses of minerals have in fact long been assessed by reference to Moh's Scale (Table 1.1). This consists of a list of materials arranged in order such that any mineral in the list will scratch any one below it. Thus diamond, the hardest substance known, with a hardness index of 10 whilst talc is soft with a hardness index of 1.
Moh's Scale is indadequate in the accurate determination of the hardness of metallic alloys. Brinell Rockwell hardness numbers are commonly used in industries to specify hardness.
(xv) Stiffness
Stiffness is the ability of a material to resist elastic deformation. A material with high value of young's modulus (E) is stiffer than material with lower value of young's modulus. For example, modulus of elasticity for aluminum and steel are 70 GPa and 210 GPa, respectively. This means steel is 3 times stiffer than aluminum. For an aluminum rod of the same cross-sectional area and subjected to the same stress, the deformation is three times that of steel rod of the same cross-sectional area.
(xvi) Machinability
The property of machinability is the ease or difficulty with which a material can be machined.
(xvii) Weldability
The property of weldability is the ease or difficulty with which a material can be welded.
(xviii) Abrasion resistance
Abrasion resistance is the resistance to wear by friction.
Stress-strain diagrams can be generated for axial tension and compression, and shear loading conditions.
The stress-strain diagram is important for establishing a number of strength and elastic characteristics of a material. To better predict the response of a structure to applied loads, the designer requires knowledge of the yield point, proportional limit, elastic limit and ultimate strength of the material of which the structure is made. This information can be obtained from the stress-strain diagram. The diagram also provides information regarding how ductile or brittle the material is.
The normal stress is obtained by dividing the applied force by the cross-sectional area of the specimen, and the normal strain is obtained by dividing the change in guage length by its original value.
A typical stress-strain diagram for mild steel is shown in figure 1.25 which illustrates the behavior of the metal when subjected to tensile stress.
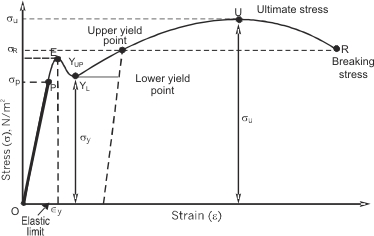
Fig. 1.25 Stress-strain diagram for mild steel
Region O to P - Stress is proportional to strain, i.e. region of linear elasticity
Region from P to E - Region of non-linear elasticity
Region O to E - Elastic range
Region E to R - Plastic range
Region U to R - Necking
Point P - Limit of proportionality
Point E - Elastic limit,
Point YUP - Upper yield point
Point YL - Lower yield point
Beyond the point E, the material is inelastic, i.e. plastic
Point U - Ultimate strength
Point R - Breaking point
σY - Yield stress
σU - Ultimate stress
σP - Maximum stress at limit of proportionality
σe - Maximum stress at elastic limit
εy - Permanent set.
During the first portion of the curve (up to a strain of 1%), the stress and strain are proportional. This holds until the point P, the proportional limit, is reached. We know stress and strain are proportional because this segment of the line is straight. The fact that there is a region in which stress and strain are proportional is called Hooke's Law. The ratio of stress to strain, or the stress per unit strain, is called an elastic modulus or Young's modulus and is essentially the slope of the straight line on the stress-strain diagram.
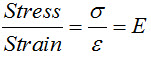
The constant, E, is the modulus of elasticity, Young's modulus or the tensile modulus and is the material's stiffness. Young's modulus is in terms of N/m2 or N/mm2.
Young's modulus is assumed to be constant for a given material. On a typical stress-strain diagram, Hooke's law applies only in the elastic stress region, in which the loading is reversible. Beyond the elastic limit (or proportional limit), the material starts to behave irreversibly. In the plastic deformation region, the stress vs. strain curve deviates from linear, and Hooke's law no longer holds.
From P to E on the diagram, stress and strain are not proportional, but on the other hand, if the stress is removed at any point between O and E, the curve will be retraced in the opposite direction and the material will return to its original shape and length. The region from P to E is the region of non-linear elasticity. In other words, the material will spring back into shape in a reverse order to the way it sprang out of shape to begin with. In the region OE, then, the material is said to be elastic or to exhibit elastic behavior and the point E is called the elastic limit. Beyond the point E, the material is inelastic, i.e. plastic.
When the stress is removed at some point beyond E, say Y, the material does not come back to its original shape or length but returns along a different path to a different point, shown along the dashed line. The length of the material at zero stress is now greater than the original length and the material is said to have a permanent set.
The points YUP and YL are the upper and lower yield points respectively.
Point U is the ultimate strength. After point U further stretching of the material is accompanied by a decrease in the engineering stress until rupture (fracture) occurs suddenly at point R. This is on account of necking.
While necking, the cross section at one point decreases, thus increasing the stress and this continues rapidly until fracture.
(a) Proportional limit is the greatest stress at which a material is capable of sustaining the applied load without deviating from the proportionality of stress to strain.
(b) Elastic limit is the point on the stress-strain curve beyond which the material permanently deforms after removing the load.
(c) Yield strength is the point at which material exceeds the elastic limit and will not return to its original or shape or length if the stress is removed.
(d) Ultimate strength is the maximum stress a material can withstand when subjected to an applied load. Dividing the load at failure by the original cross sectional area determines this value.
Consolidated table of material properties at a glance and their respective explanation are given the table 2.2.
| Strength | The measure of how much stress a material withstands a heavy load without breaking. |
| Tensile Strength | The maximum stress a material can withstand under tension. |
| Compressive Strength | Maximum stress a material can withstand under compression. |
| Hardness | The resistance a material has to indentation, abrasion, scroching cutting etc. |
| Toughness | This describes the amount of energy a material can absorb before rupture. This is the opposite of brittleness. |
| Brittleness | The tendency of a metal or material to fracture without undergoing appreciable plastic deformation. |
| Creep | Deformation that occurs over period of time when a material is subjected to constant stress at constant temperature is known as creep. |
| Fatigue | Failure or Permanent structural change that occurs in a material on account of fluctuating stress. |
| Malleability | Ability of a material to be flattened into thin sheets without cracking by hammering, pressing & rolling. |
| Ductility | It is the property of a material to be drawn out into thin wire. It is the extent to which a material can sustain plastic deformation without rupture. Elongation and reduction of area are common indices of ductility. |
| Elasticity | It is the ability of a material to return to undeformed state when the applied load is removed. |
| Plasticity | Tendency of a material to remain deformed, after removal of applied load without ruptare. |
| Thermal and Electrical conductivity | The measure of how well a material can conduct heat or electricity. |
Table 2.3: Metal/alloys arranged in descending order value of mechanical property
| Toughness | Ductility | Malleability | Brittleness | Corrosion resistance |
| Copper | Gold | Gold | White cast iron | Gold |
| Nickel | Silver | Silver | Gray cast iron | Platinum |
| Iron | Platinum | Aluminium | Hardened steel | Silver |
| Magnesium | Iron | Copper | Bismuth | Mercury |
| Zinc | Nickel | Tin | Manganese | Copper |
| Aluminum | Copper | Lead | Bronzes | Lead |
| Lead | Aluminum | Zinc | Aluminium | Tin |
| Tin | Tungsten | Iron | Brass | Nickel |
| Cobalt | Zinc | Structural steels | Iron | |
| Bismuth | Tin | Monel | Magnesium |
Some truths about properties of metals:
(i) Ductile materials deform quite a bit before the ultimate stress, necking typically occurs before rupture.
(ii) Brittle material does not deform much and simply breaks. Or simply the ultimate and rupture strengths are the same.
(iii) The strain-hardening of some materials occurs as they are stretched, the Ultimate Tensile Strength increases, but Young's modulus remains the same.
(iv) Each material will have it's own stress-strain curve and these are determined experimentally.
(v) While necking, the cross-section at one point decreases, thus increasing the stress. In turn this continues rapidly until fracture.
(vi) The area under the stress strain curve indicates toughness. A larger area under a stress strain curve will make a material that must be extensively deformed before it will fail.
(vii) Creep is an effect that can lead to permanently elongated specimens.
(viii) If the material becomes permanently deformed this is known as plastic deformation.
(ix) Under simple axial loads, metals and other materials act like simple springs. This behavior is known as elastic.
| Lecture 2 | Lecture 4 |